2023
Self
Github

Background
This project is a part of the Internship. The task involves analyzing the popular Iris dataset to predict the optimal number of clusters using clustering techniques and visually representing the results. It demonstrates the application of machine learning and data visualization tools to uncover patterns and insights. The notebook uses Python libraries such as NumPy, Pandas, Matplotlib, and Seaborn to perform the analysis and create visualizations, showcasing a blend of data science and analytical skills.


Results and Impact
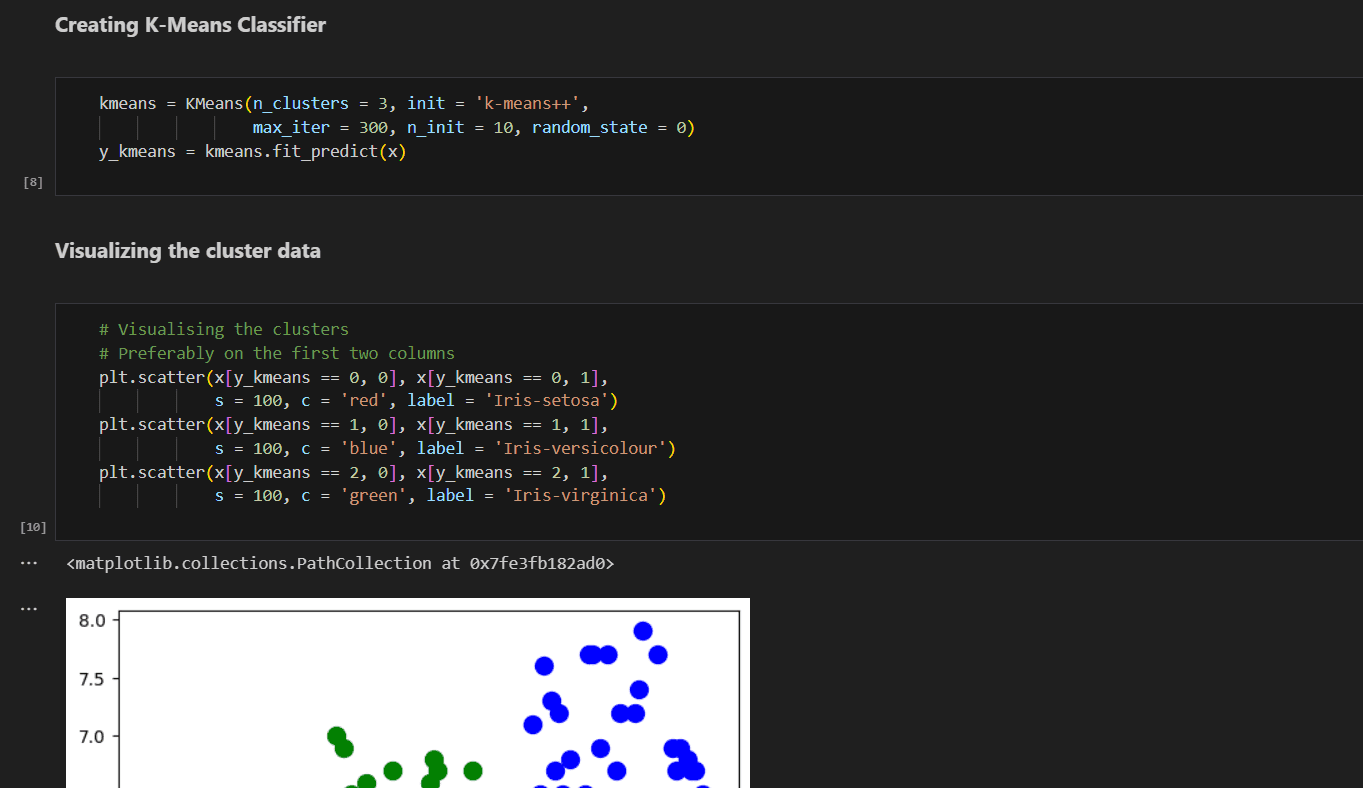
This project analyzes the Iris dataset to predict the optimal number of clusters and visually represent them using the K-Means clustering algorithm. The process involves loading the dataset, exploring its structure, and applying the elbow method to determine the optimal number of clusters by plotting the Within-Cluster Sum of Squares (WCSS) for different cluster counts. The analysis identifies three clusters as optimal, which are then visualized to illustrate the separation of data points. This project demonstrates effective application of machine learning techniques and visualization tools to cluster data and draw meaningful insights.